
WooCommerce: Sales Performance Reporting (Complete Guide)
Running a successful WooCommerce store requires more than simply generating sales—you need to understand why sales increase or decrease. Sales performance reporting helps store owners monitor key business metrics, identify trends, optimize marketing campaigns, and make data-driven decisions that increase profitability.
WooCommerce includes built-in reporting features, and when combined with advanced analytics tools, you can gain deep insights into revenue, customer behavior, product performance, inventory, and marketing ROI.
This comprehensive guide explains everything you need to know about WooCommerce sales performance reporting.
What is Sales Performance Reporting?
Sales performance reporting is the process of tracking and analyzing your store’s sales data to measure business performance.
It helps answer important questions such as:
- Which products generate the most revenue?
- Which marketing campaigns perform best?
- What is the average order value?
- Which customers spend the most?
- Which products need improvement?
Regular reporting helps improve profitability and business growth.
Why Sales Reports Matter
Sales reports allow you to:
- Monitor business growth
- Improve marketing decisions
- Forecast future sales
- Identify best-selling products
- Reduce operating costs
- Optimize inventory
- Increase customer retention
Businesses that monitor data consistently make better strategic decisions.
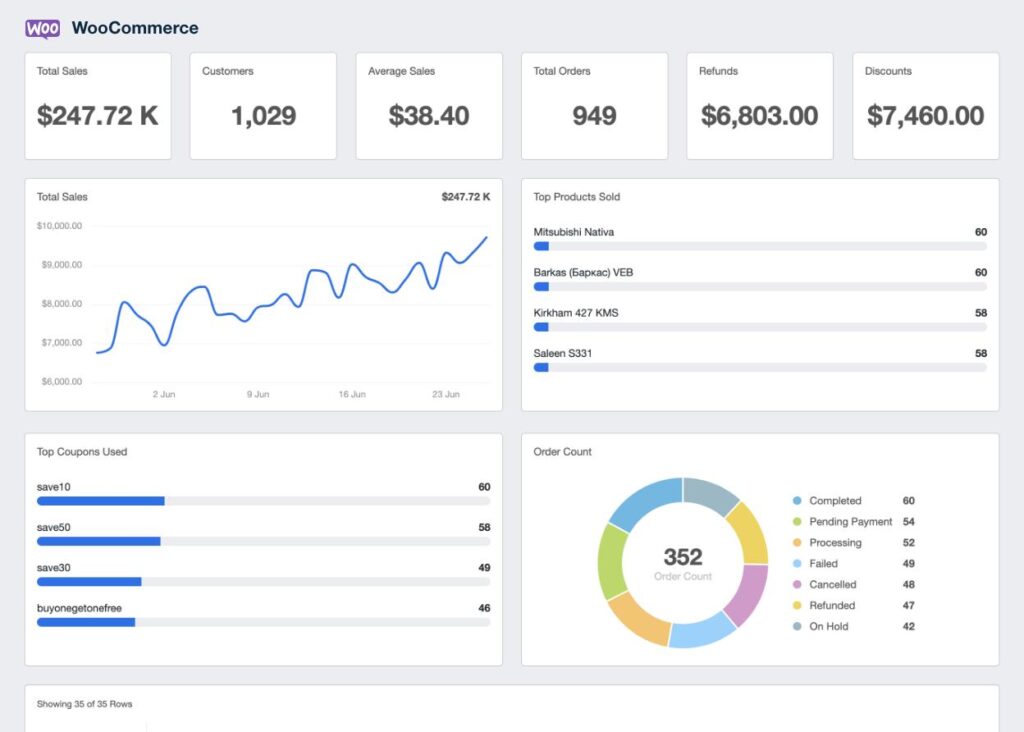
WooCommerce Analytics Dashboard
WooCommerce includes an analytics dashboard that displays:
Total Revenue
Overall sales generated during the selected period.
Net Sales
Revenue after refunds and discounts.
Orders
Number of completed orders.
Products Sold
Total quantity sold.
Refunds
Returned orders and refund amounts.
Coupons Used
Discount performance.
The dashboard provides a quick overview of store performance.
Revenue Reports
Monitor revenue using different time periods.
Daily Revenue
Track daily sales activity.
Weekly Revenue
Compare week-over-week performance.
Monthly Revenue
Analyze monthly growth.
Annual Revenue
Measure long-term business performance.
Historical comparisons reveal important trends.
Order Reports
Track order activity including:
New Orders
Completed Orders
Processing Orders
Cancelled Orders
Refunded Orders
Failed Payments
Order reports help identify operational issues.
Product Performance Reports
Analyze product sales using metrics such as:
Best-Selling Products
Lowest-Selling Products
Revenue by Product
Product Conversion Rate
Product Views
Average Selling Price
Understanding product performance helps optimize your catalog.
Customer Analytics
Customer reports include:
New Customers
Returning Customers
Customer Lifetime Value (CLV)
Average Purchase Value
Repeat Purchase Rate
Customer Location
Customer insights support better marketing campaigns.
Average Order Value (AOV)
Average Order Value measures how much customers spend per purchase.
Formula:
AOV = Total Revenue ÷ Number of Orders
Increase AOV through:
- Product bundles
- Upselling
- Cross-selling
- Free shipping thresholds
A higher AOV increases profitability without acquiring more customers.
Conversion Rate Reporting
Monitor:
Store Visitors
Product Views
Add-to-Cart Rate
Checkout Completion Rate
Purchase Conversion Rate
Improving conversion rates increases sales.
Sales by Category
Track performance for each category.
Examples:
- Electronics
- Fashion
- Home & Garden
- Sports
- Digital Products
Category reports help identify growth opportunities.
Coupon Performance
Measure marketing success through:
Coupon Usage
Revenue Generated
Conversion Rate
Average Discount
Customer Acquisition
Evaluate whether promotions generate profitable sales.
Inventory Reports
Monitor stock performance.
Track:
Low Stock Products
Out-of-Stock Items
Inventory Value
Fast-Moving Products
Slow-Moving Products
Inventory reports help avoid lost sales.
Refund Analysis
Monitor:
Refund Amount
Refund Rate
Refund Reasons
Most Returned Products
Reducing refunds improves profitability.
Geographic Sales Reports
Analyze revenue by:
Country
State
City
Region
Geographic reports support international expansion and local marketing.
Marketing Performance
Evaluate marketing channels.
Track:
Organic Search
Paid Advertising
Email Marketing
Social Media
Referral Traffic
Affiliate Sales
Understanding channel performance improves ROI.
Financial Reporting
Monitor financial health.
Include:
Gross Revenue
Net Revenue
Taxes
Shipping Income
Discounts
Operating Profit
Financial reports assist with budgeting and forecasting.
Custom Reports
Build reports based on:
- Date Range
- Product Category
- Vendor
- Customer
- Coupon
- Payment Gateway
Custom reports provide business-specific insights.
Sales Forecasting
Predict future performance using:
Historical Sales
Seasonal Trends
Marketing Campaigns
Inventory Levels
Customer Demand
Forecasting supports better planning.
AI-Powered Analytics
Modern reporting tools can provide:
Revenue Predictions
Product Recommendations
Customer Segmentation
Inventory Forecasts
Marketing Suggestions
AI helps identify growth opportunities faster.
Export Reports
Allow reports to be exported as:
CSV
Excel
Google Sheets
Exported reports simplify accounting and business analysis.
Mobile Reporting
Business owners should access reports from any device.
Support:
Responsive Dashboard
Interactive Charts
Sales Notifications
Mobile KPIs
Real-time mobile reporting improves decision-making.
Performance Optimization
Large stores generate significant reporting data.
Improve speed using:
LiteSpeed Cache
Redis Object Cache
Database Optimization
Cloudflare CDN
Scheduled Report Generation
Fast reports improve usability.
Security Best Practices
Protect business data using:
SSL Certificate
Role-Based Permissions
Two-Factor Authentication
Activity Logs
Daily Backups
Financial reports should only be accessible to authorized users.
Best WooCommerce Reporting Plugins
Metorik
A powerful reporting platform with real-time dashboards, customer analytics, and advanced revenue reports.
Best For
Growing WooCommerce businesses.
WooCommerce Admin Analytics
The built-in reporting solution with modern dashboards and key performance indicators.
Best For
Most WooCommerce stores.
Advanced WooCommerce Reporting
Provides detailed sales, customer, and inventory reports with customizable filters.
Best For
Businesses needing advanced reporting.
MonsterInsights
Connects WooCommerce with analytics for eCommerce tracking and marketing insights.
Best For
Marketing-focused businesses.
WP Statistics
Tracks website visitors and traffic without relying on external services.
Best For
Store owners who prefer self-hosted analytics.
Recommended Plugin Stack
WooCommerce
Core eCommerce platform.
Metorik
Advanced reporting and analytics.
MonsterInsights
Marketing and traffic analytics.
WP Statistics
Visitor tracking.
FluentCRM
Customer relationship management.
Rank Math SEO
Search engine optimization.
WP Mail SMTP
Reliable email notifications.
LiteSpeed Cache
Performance optimization.
Redis Object Cache
Database caching.
Cloudflare
Security and CDN.
This plugin stack provides a complete analytics and reporting ecosystem.
Common Reporting Mistakes
Tracking Too Few Metrics
Misses important business insights.
Ignoring Customer Data
Limits marketing effectiveness.
No Sales Forecasting
Makes inventory planning difficult.
Poor Dashboard Performance
Slows decision-making.
Not Reviewing Reports Regularly
Prevents timely optimization.
Ignoring Refund Trends
Can reduce profitability.
Avoiding these mistakes leads to smarter business decisions.
Sales Performance Reporting Checklist
✅ Revenue Dashboard
✅ Order Reports
✅ Product Analytics
✅ Customer Analytics
✅ Average Order Value
✅ Conversion Tracking
✅ Inventory Reports
✅ Refund Analysis
✅ Marketing Reports
✅ Financial Reports
✅ AI Forecasting
✅ Export Options
✅ Mobile Dashboard
✅ Performance Optimization
✅ Security Hardening
Final Thoughts
Sales performance reporting is the foundation of a successful WooCommerce business. By monitoring revenue, customer behavior, product performance, inventory, and marketing campaigns, you gain the insights needed to improve profitability and make informed decisions.
Whether you’re managing a small online shop or a high-volume eCommerce store, combining WooCommerce analytics with advanced reporting tools gives you a complete view of your business. Regularly reviewing reports, acting on trends, and optimizing based on data will help you increase sales, improve customer satisfaction, and build a more sustainable business.

Hire Me on Upwork – Dokan & WooCommerce Expert

 Chat on WhatsApp