
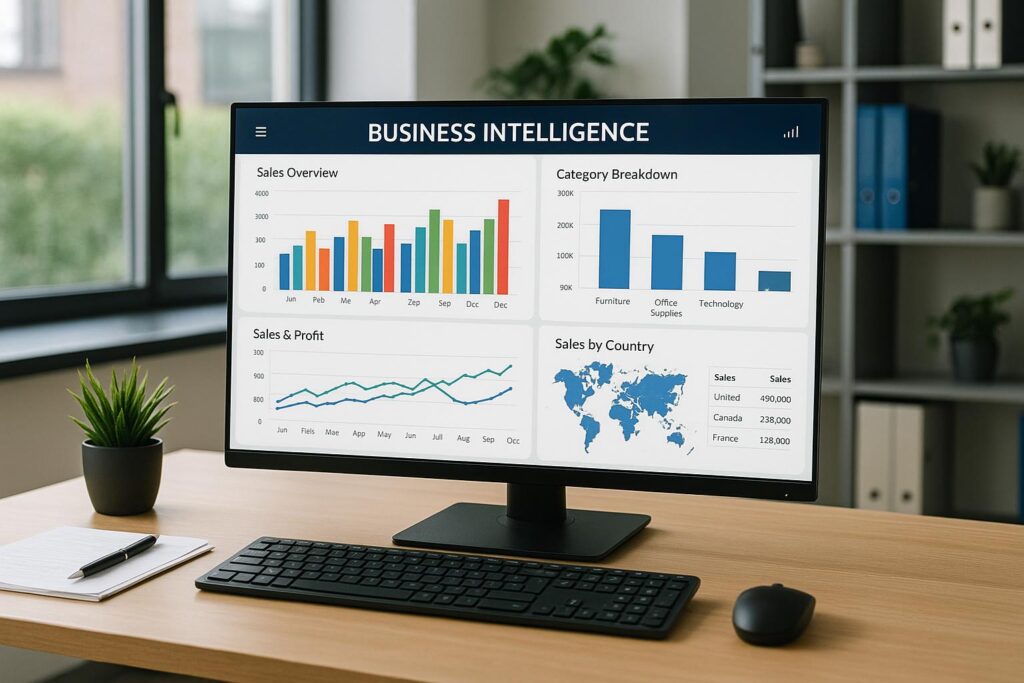
WordPress: Business Dashboard Development (Complete Guide)
Modern businesses rely on dashboards to make informed decisions quickly. Instead of manually reviewing spreadsheets, reports, and databases, a business dashboard provides real-time insights into sales, revenue, customers, inventory, marketing, and overall business performance—all from a single interface.
WordPress is more than just a content management system. With the right plugins, APIs, and custom development, it can become a powerful business intelligence platform that centralizes data from multiple sources and presents it in an easy-to-understand dashboard.
This guide explains how to build a professional business dashboard in WordPress, including planning, design, development, integrations, analytics, security, and performance optimization.
What is a Business Dashboard?
A business dashboard is a centralized interface that displays key business metrics and reports.
Instead of opening multiple applications, users can monitor everything from one screen.
Typical dashboard data includes:
- Revenue
- Sales
- Orders
- Customers
- Website Traffic
- Marketing Performance
- Inventory
- Financial Reports
- Team Performance
- Support Tickets
Dashboards help business owners make faster, data-driven decisions.
Why Build a Business Dashboard?
A custom WordPress dashboard offers several benefits.
Real-Time Reporting
Monitor business performance instantly.
Better Decision Making
Access accurate business insights.
Increased Productivity
Reduce time spent gathering reports.
Improved Team Collaboration
Share important metrics across departments.
Centralized Data
View information from multiple platforms in one place.
A centralized dashboard improves efficiency and visibility.
Types of Business Dashboards
WordPress can power different dashboard types.
Executive Dashboard
High-level KPIs for business owners.
Sales Dashboard
Revenue, orders, and customer analytics.
Marketing Dashboard
Campaign performance and lead generation.
Customer Dashboard
Customer accounts and activity.
Financial Dashboard
Revenue, expenses, taxes, and profit.
Inventory Dashboard
Stock levels and warehouse management.
HR Dashboard
Employee attendance and productivity.
Project Dashboard
Tasks, milestones, and deadlines.
Choose a dashboard based on your business goals.
Planning Your Dashboard
Before development, define:
- Business objectives
- User roles
- Required metrics
- Data sources
- Reporting frequency
- Security requirements
Proper planning reduces future development costs.
User Roles & Permissions
Create dashboards for different users.
Examples:
Administrator
Full system access.
Manager
Department reports.
Sales Team
Sales and customer metrics.
Marketing Team
Campaign analytics.
Customers
Account and order information.
Vendors
Store performance (for marketplaces).
Role-based access protects sensitive information.
Dashboard Layout
A professional dashboard should include:
KPI Cards
Quick overview of important metrics.
Interactive Charts
Visualize trends.
Recent Activity
Display the latest events.
Tables
Detailed reports.
Filters
Search by date, category, or department.
Notifications
Highlight important updates.
Clean layouts improve usability.
Key Performance Indicators (KPIs)
Track metrics such as:
Revenue
Profit
Orders
Customers
Conversion Rate
Average Order Value
Customer Lifetime Value
Inventory Value
Choose KPIs that align with business objectives.
Sales Dashboard
Display:
Daily Sales
Weekly Sales
Monthly Revenue
Best-Selling Products
Sales by Category
Refunds
Sales analytics help improve revenue.
Customer Analytics
Monitor:
New Customers
Returning Customers
Customer Retention
Customer Lifetime Value
Geographic Distribution
Customer insights improve marketing decisions.
Marketing Dashboard
Track:
Website Traffic
Organic Search
Paid Campaigns
Email Marketing
Social Media Performance
Lead Generation
Marketing analytics improve campaign ROI.
Financial Reporting
Include:
Gross Revenue
Net Revenue
Expenses
Taxes
Cash Flow
Profit & Loss
Financial reports support strategic planning.
Inventory Dashboard
Monitor:
Low Stock Alerts
Out-of-Stock Products
Inventory Value
Warehouse Status
Product Movement
Inventory visibility reduces stock issues.
Project Management Dashboard
Useful for agencies and service businesses.
Display:
Active Projects
Task Progress
Deadlines
Team Workload
Client Status
Project dashboards improve productivity.
CRM Integration
Connect with CRM platforms such as:
FluentCRM
HubSpot
Zoho CRM
Salesforce
Centralized customer data improves business operations.
API Integrations
Connect WordPress with external services.
Examples:
Google Analytics
Stripe
PayPal
WooCommerce
Slack
Mailchimp
Zapier
APIs allow real-time synchronization between systems.
Interactive Charts
Display data using:
Line Charts
Bar Charts
Pie Charts
Area Charts
Tables
Heat Maps
Visual reports simplify complex data.
Real-Time Notifications
Alert users about:
New Orders
Low Inventory
Payment Failures
Support Tickets
New Leads
Goal Completion
Notifications keep teams informed.
Mobile Dashboard
Ensure your dashboard supports:
Responsive Design
Touch-Friendly Controls
Mobile Charts
Push Notifications
Business owners can monitor performance from anywhere.
AI Features
Enhance dashboards with AI.
Examples:
Revenue Forecasting
Sales Predictions
Customer Segmentation
Inventory Forecasting
Smart Recommendations
AI transforms dashboards into decision-support systems.
Export & Reporting
Allow users to export reports as:
Excel
CSV
Google Sheets
Export features simplify meetings and accounting.
Performance Optimization
Dashboards often process large amounts of data.
Optimize using:
LiteSpeed Cache
Redis Object Cache
Database Indexing
Lazy Loading Charts
Cloudflare CDN
Fast dashboards improve user experience.
Security Best Practices
Protect business data using:
SSL Certificate
Two-Factor Authentication
Role-Based Access Control
Activity Logs
Secure APIs
Daily Backups
Business dashboards often contain confidential information.
Best WordPress Dashboard Plugins
Fluent Boards
Project management and business collaboration within WordPress.
Best For
Agencies and teams managing projects.
WP ERP
An all-in-one business management plugin offering HR, CRM, accounting, and reporting dashboards.
Best For
Small and medium-sized businesses.
Metorik
Advanced WooCommerce reporting with real-time analytics and customer insights.
Best For
WooCommerce stores.
WP Statistics
Tracks website traffic and visitor behavior without relying on external services.
Best For
Privacy-focused businesses.
Admin Columns Pro
Customize WordPress admin screens with sortable columns, filters, and business data.
Best For
Improving admin productivity.
Recommended Plugin Stack
WordPress
Core website platform.
WooCommerce
eCommerce functionality.
WP ERP
Business management and reporting.
FluentCRM
Customer relationship management.
Fluent Boards
Project management.
WP Statistics
Website analytics.
Rank Math SEO
Search engine optimization.
WP Mail SMTP
Reliable email notifications.
LiteSpeed Cache
Performance optimization.
Redis Object Cache
Database optimization.
Cloudflare
Security and CDN.
This stack provides a complete business management and reporting solution.
Common Dashboard Development Mistakes
Tracking Too Many Metrics
Creates information overload.
Poor Mobile Design
Limits accessibility.
Slow Data Loading
Hurts productivity.
Weak User Permissions
Risks sensitive business data.
No API Integration
Requires manual reporting.
Ignoring Performance
Slows the dashboard as data grows.
Avoiding these issues creates a more effective dashboard.
Business Dashboard Development Checklist
✅ KPI Dashboard
✅ Sales Reports
✅ Customer Analytics
✅ Marketing Dashboard
✅ Financial Reports
✅ Inventory Tracking
✅ CRM Integration
✅ API Connectivity
✅ Interactive Charts
✅ Mobile Responsive
✅ Export Options
✅ AI Insights
✅ Performance Optimization
✅ Security Hardening
Final Thoughts
A custom WordPress business dashboard gives organizations a centralized view of their operations, helping decision-makers monitor performance and act quickly. Whether you’re managing an eCommerce store, a service agency, a membership platform, or a multi-vendor marketplace, dashboards provide the visibility needed to improve efficiency and drive growth.
By combining WordPress with CRM integrations, analytics tools, API connections, AI-powered insights, and strong security practices, you can create a scalable dashboard that supports your business today and adapts as your needs evolve.
SEO Details
SEO Title
Meta Description
Focus Keyword
Suggested URL Slug
Suggested Tags

Hire Me on Upwork – Dokan & WooCommerce Expert

 Chat on WhatsApp