
Running a multivendor marketplace without analytics is like driving with your eyes closed.
You may have:
-
Vendors selling products
-
Orders coming in
-
Revenue increasing
But without proper analytics, you don’t really know:
-
Which vendors are profitable
-
Which products perform best
-
Where revenue leaks happen
-
Why vendors churn
This guide explains Dokan Analytics & Reports in detail, so you can:
-
Track marketplace performance
-
Make data-driven decisions
-
Improve vendor success
-
Scale your Dokan marketplace confidently
🔴 Why Analytics & Reports Matter in Dokan
In a Dokan marketplace, analytics help three key stakeholders:
👤 Admin (You)
-
Track total revenue & commissions
-
Identify top & weak vendors
-
Monitor refunds & disputes
-
Plan growth strategy
🏪 Vendors
-
Track sales performance
-
Understand customer behavior
-
Improve product listings
👥 Customers (Indirectly)
-
Better products
-
Faster fulfillment
-
Improved experience
👉 Good analytics = healthier marketplace ecosystem
🧠 How Dokan Analytics Works (High-Level Overview)
Dokan analytics is built on top of WooCommerce order data and vendor records.
Basic data flow:
1️⃣ Customer places an order
2️⃣ Order stored in WooCommerce
3️⃣ Dokan assigns vendor data
4️⃣ Sales & commission calculated
5️⃣ Reports generated for admin & vendors
If analytics is ignored, performance issues remain hidden.
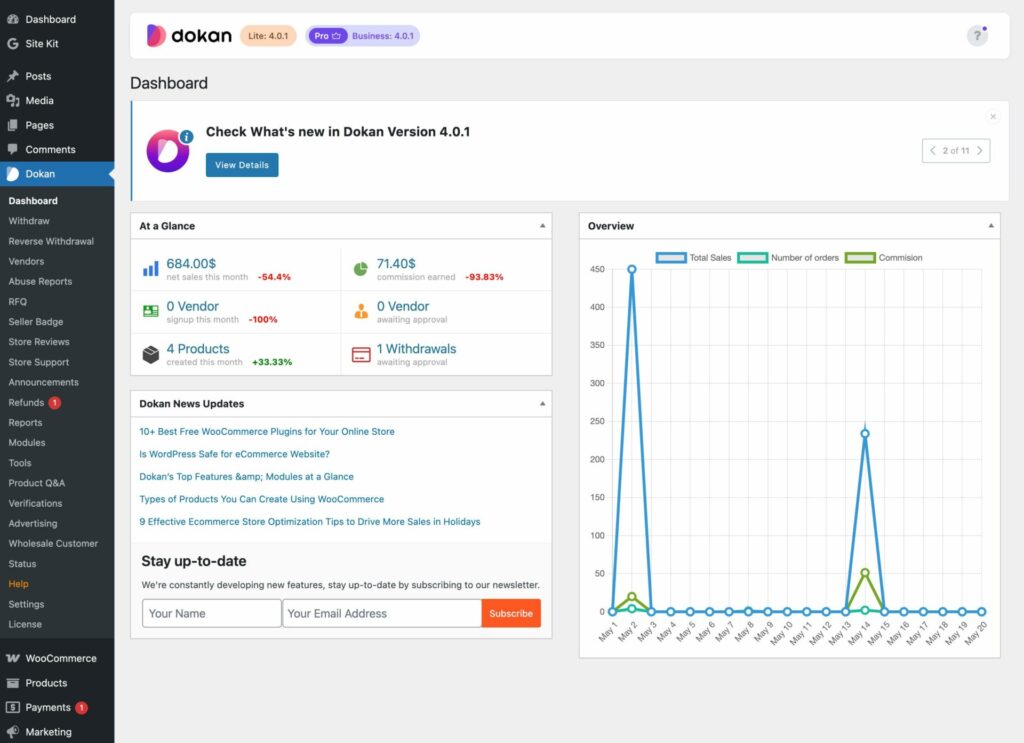
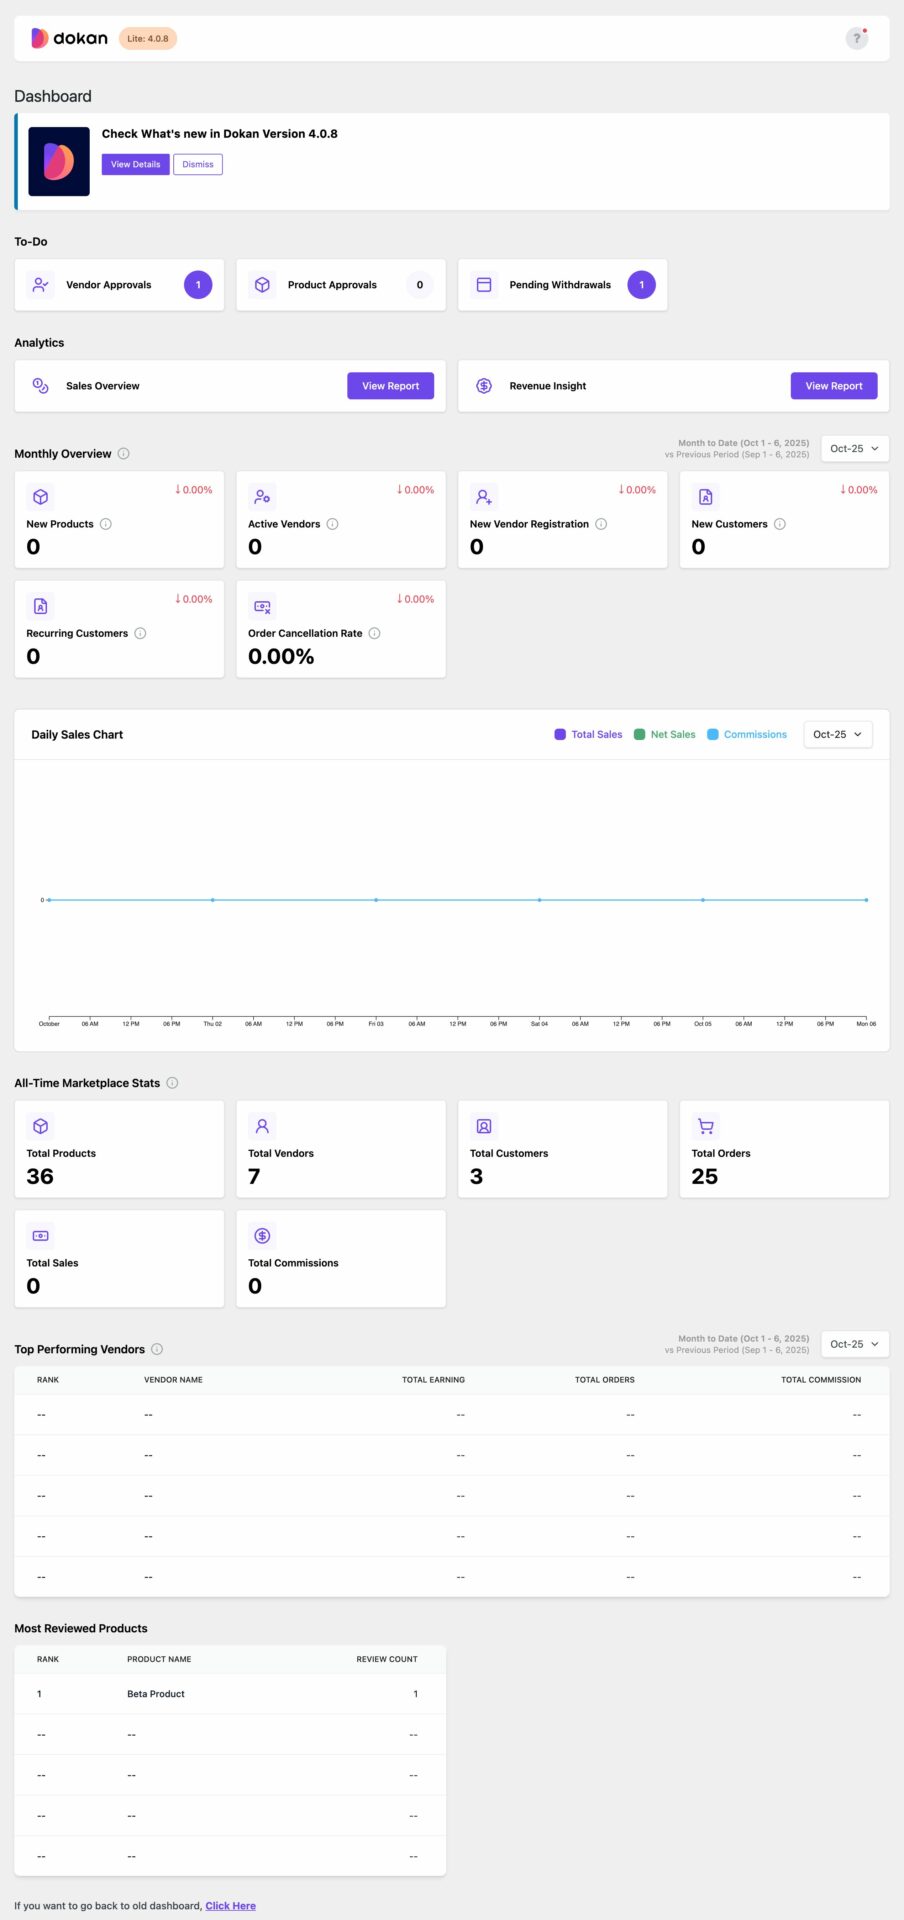
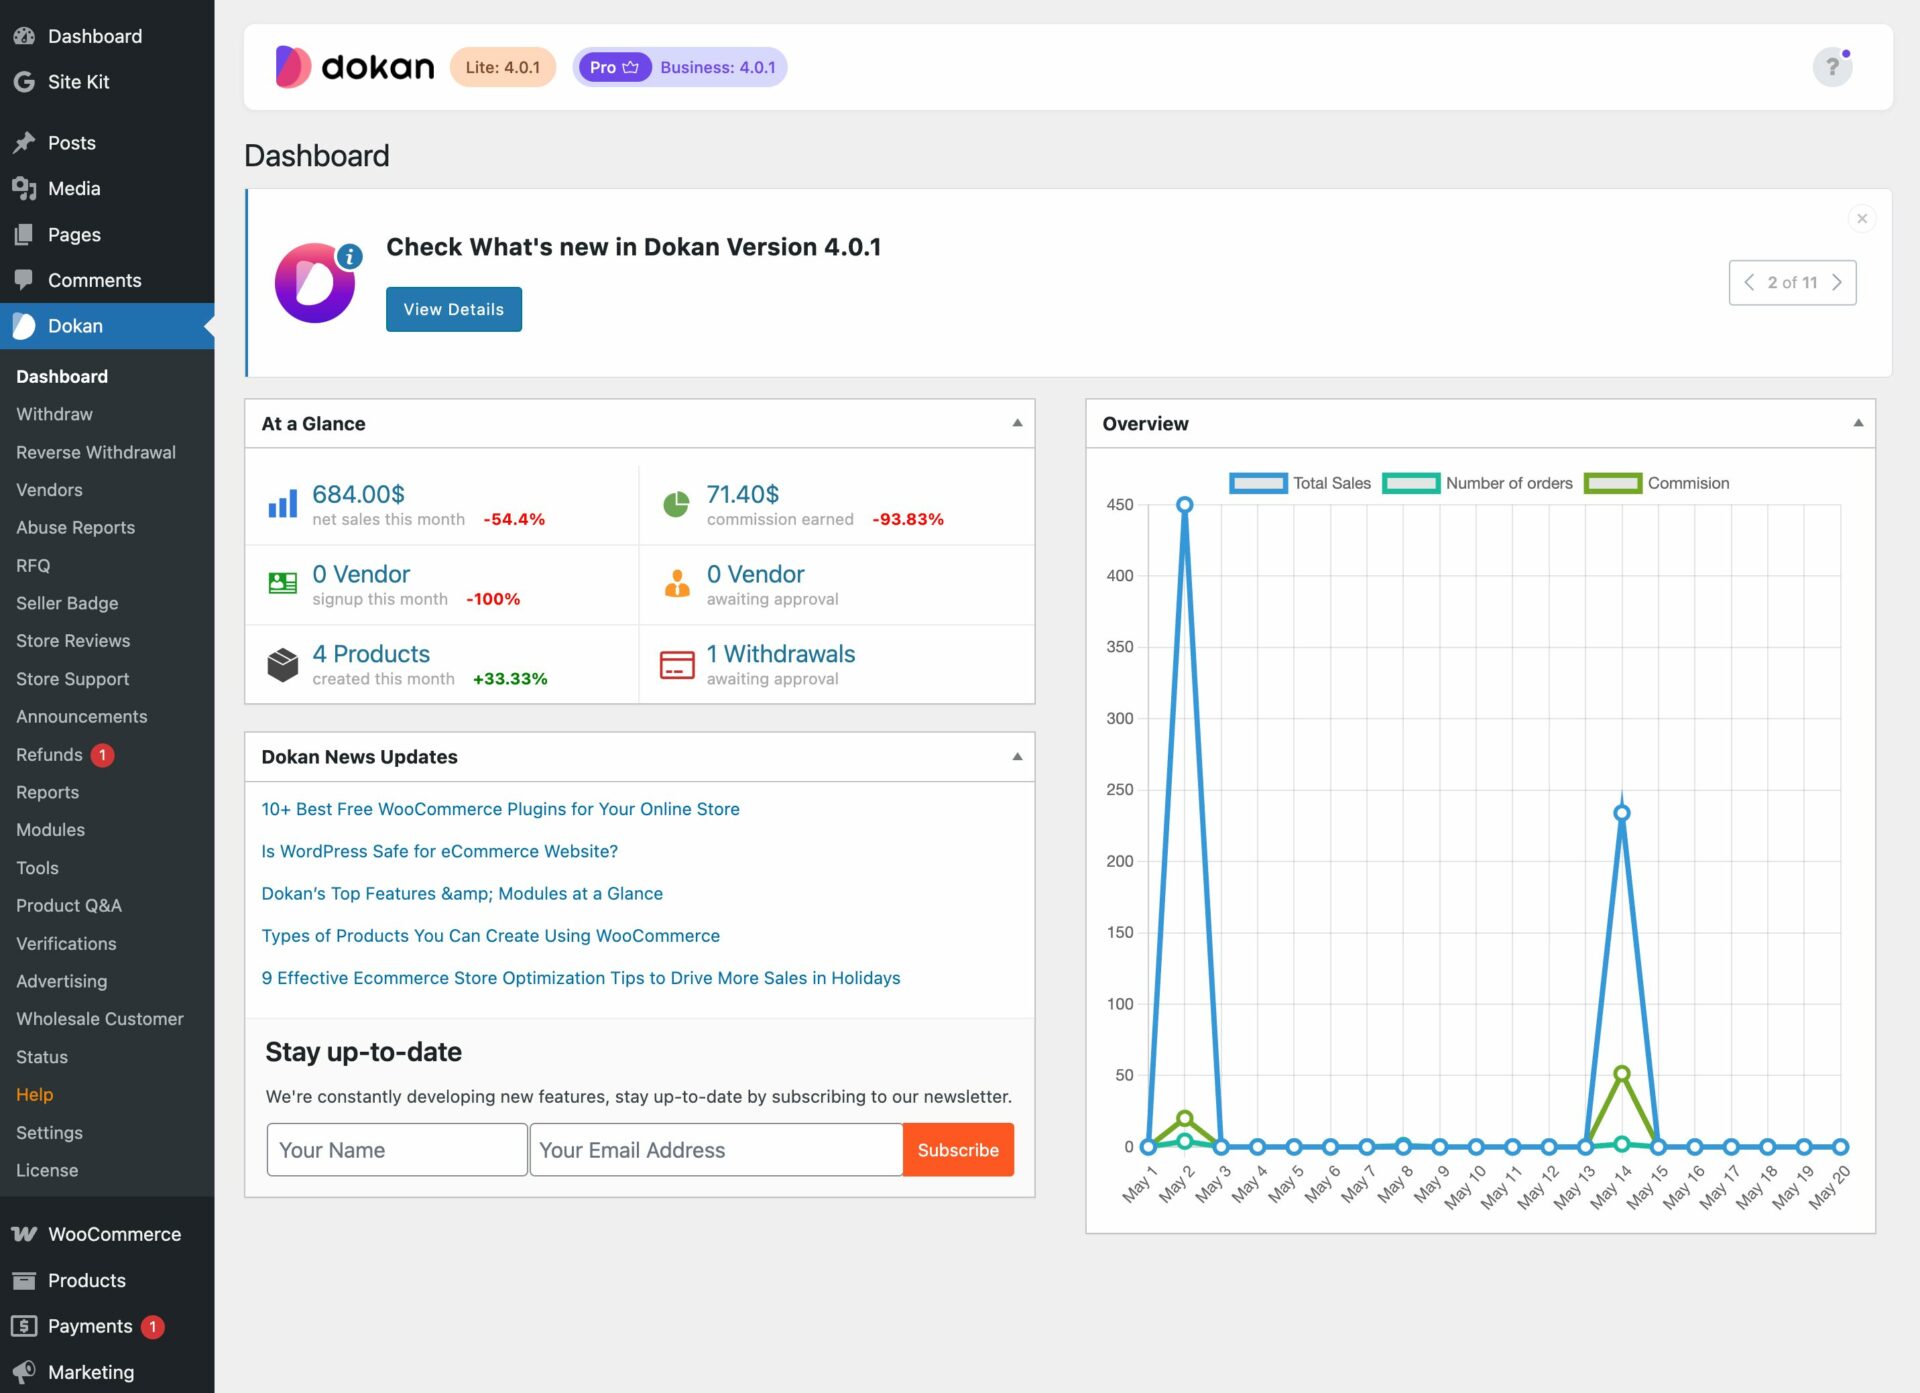
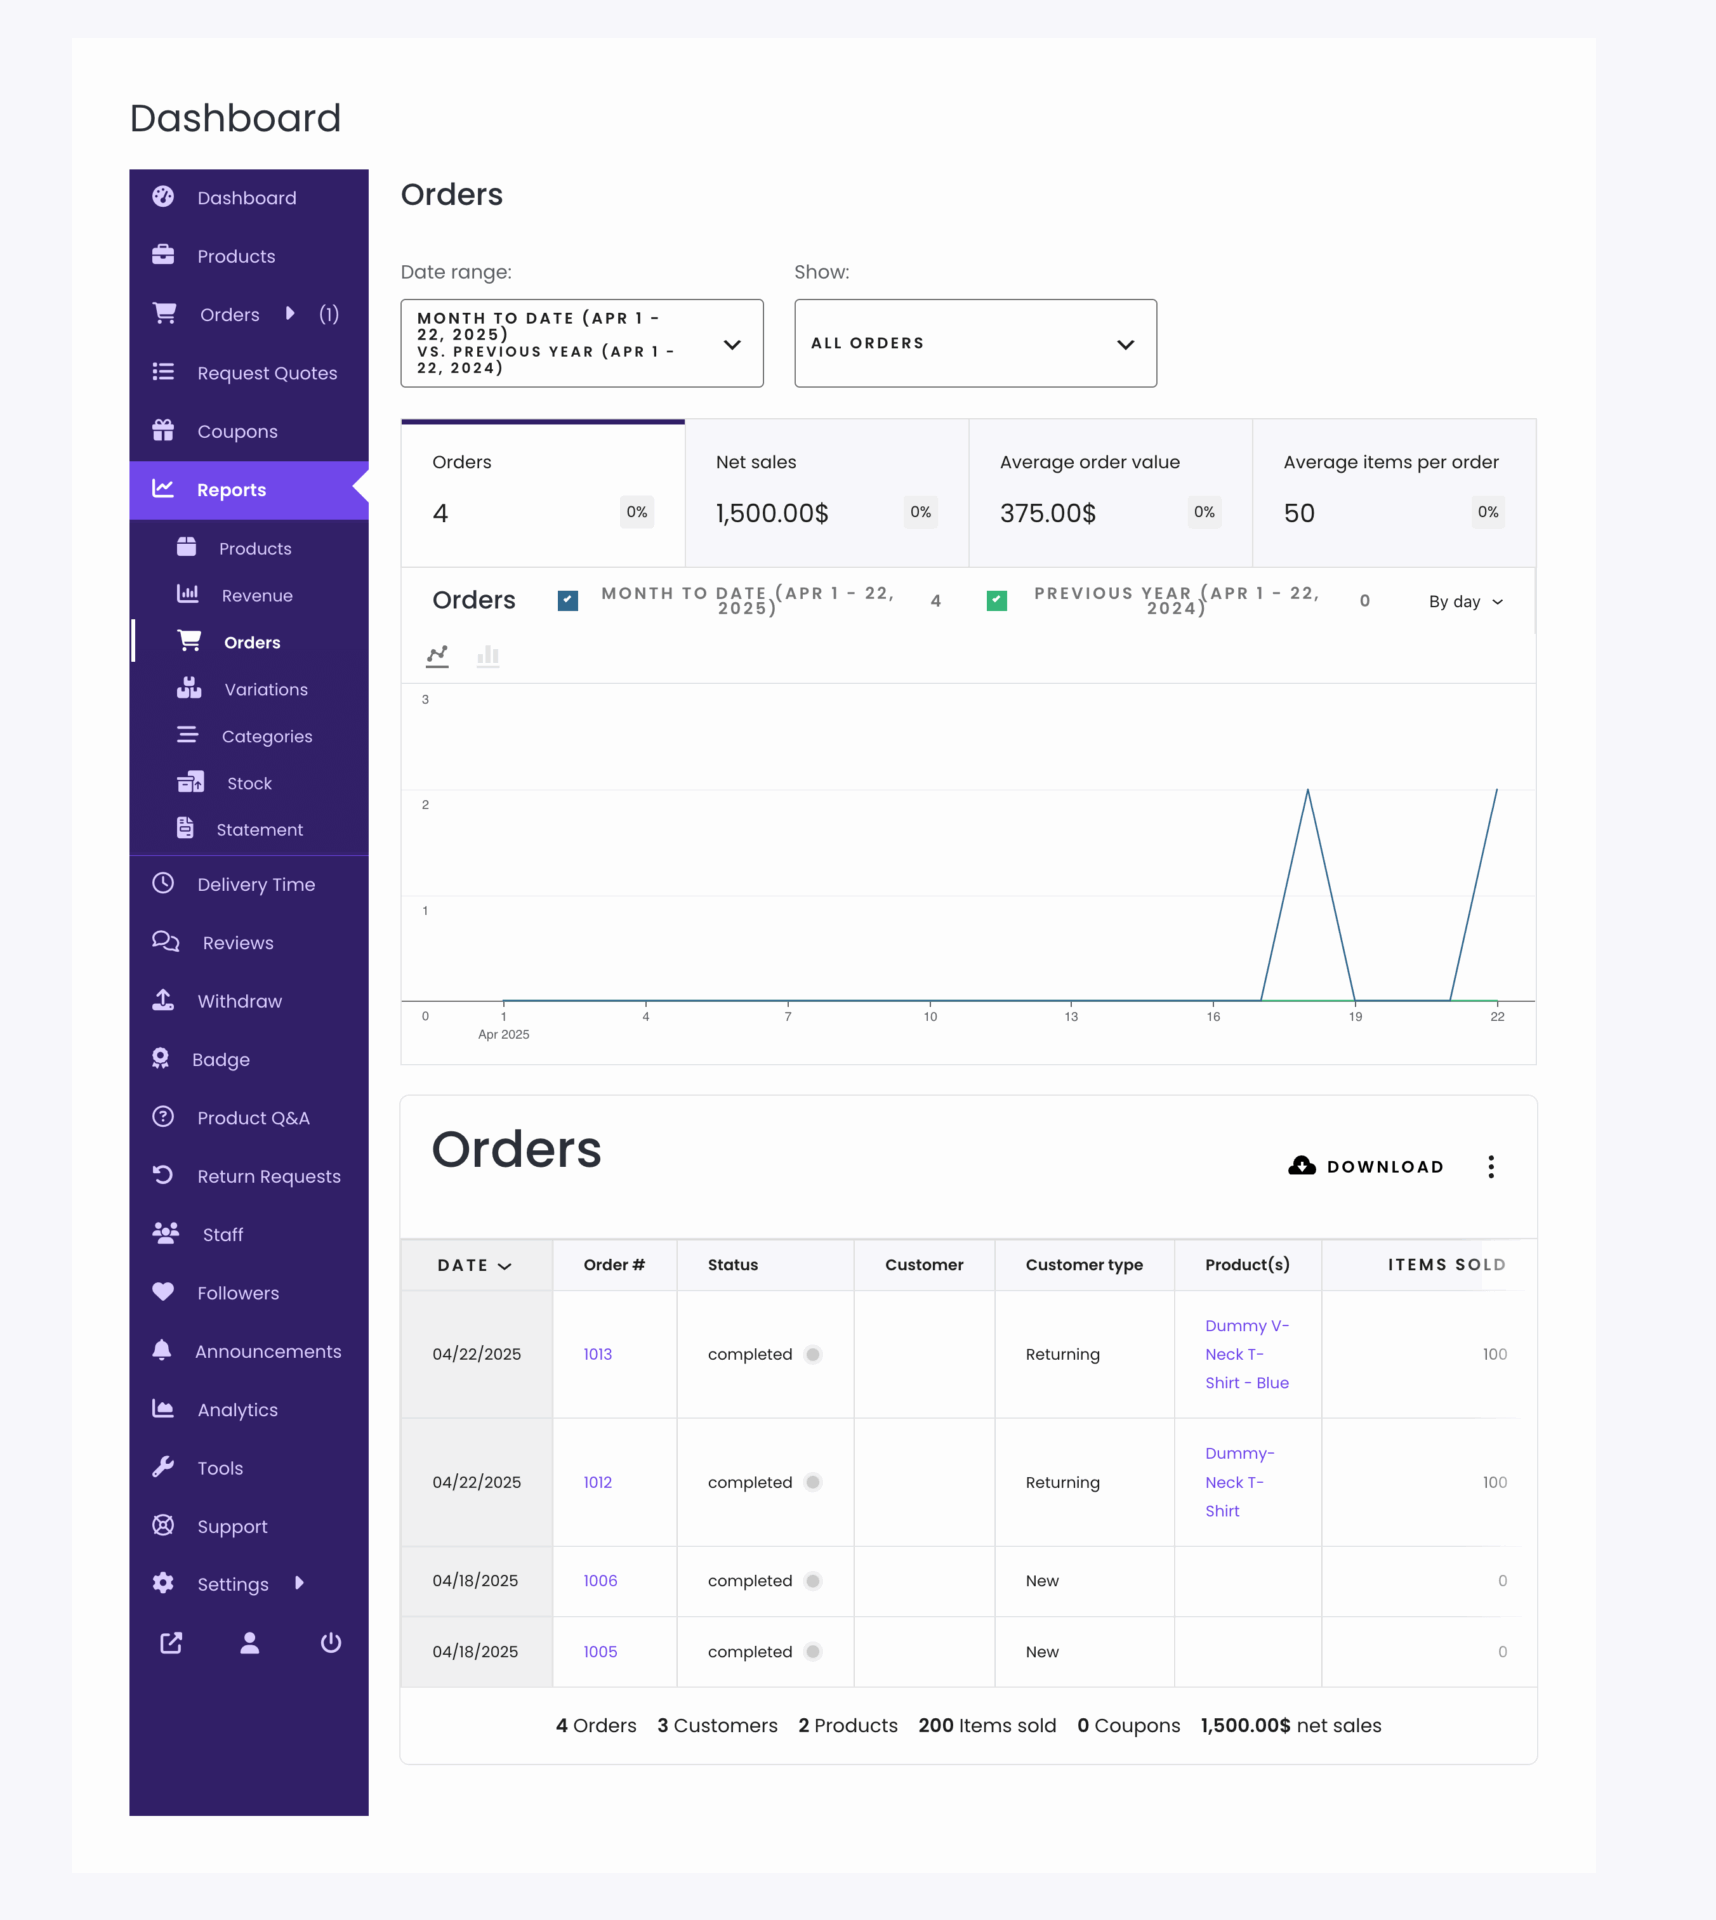
1️⃣ Dokan Admin Analytics Dashboard Explained
The Admin Dashboard gives a bird’s-eye view of your marketplace.
🔹 Key Metrics Available:
-
Total sales
-
Total commissions
-
Vendor earnings
-
Order count
-
Refunds & withdrawals
These metrics help admins quickly answer:
👉 “Is my marketplace actually profitable?”
2️⃣ Vendor Analytics Dashboard Explained
Each vendor gets access to their own performance data.
🔹 Vendor Can Track:
-
Total sales
-
Orders per period
-
Earnings after commission
-
Top-selling products
-
Recent customer activity
📌 This transparency:
✔ Builds trust
✔ Motivates vendors
✔ Reduces support queries

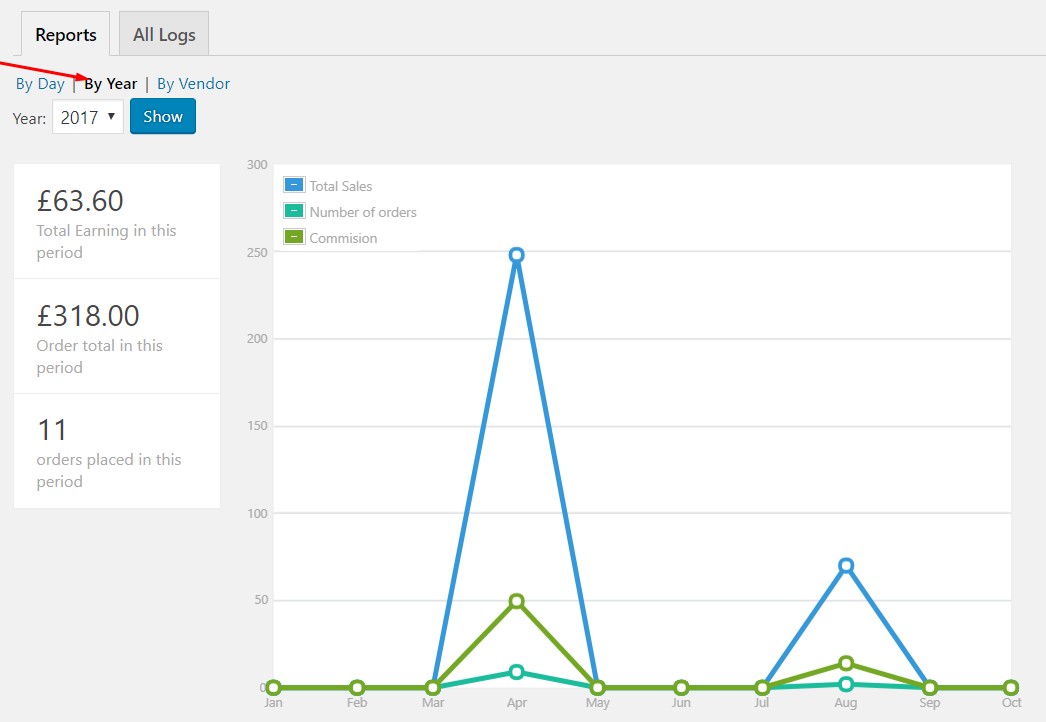
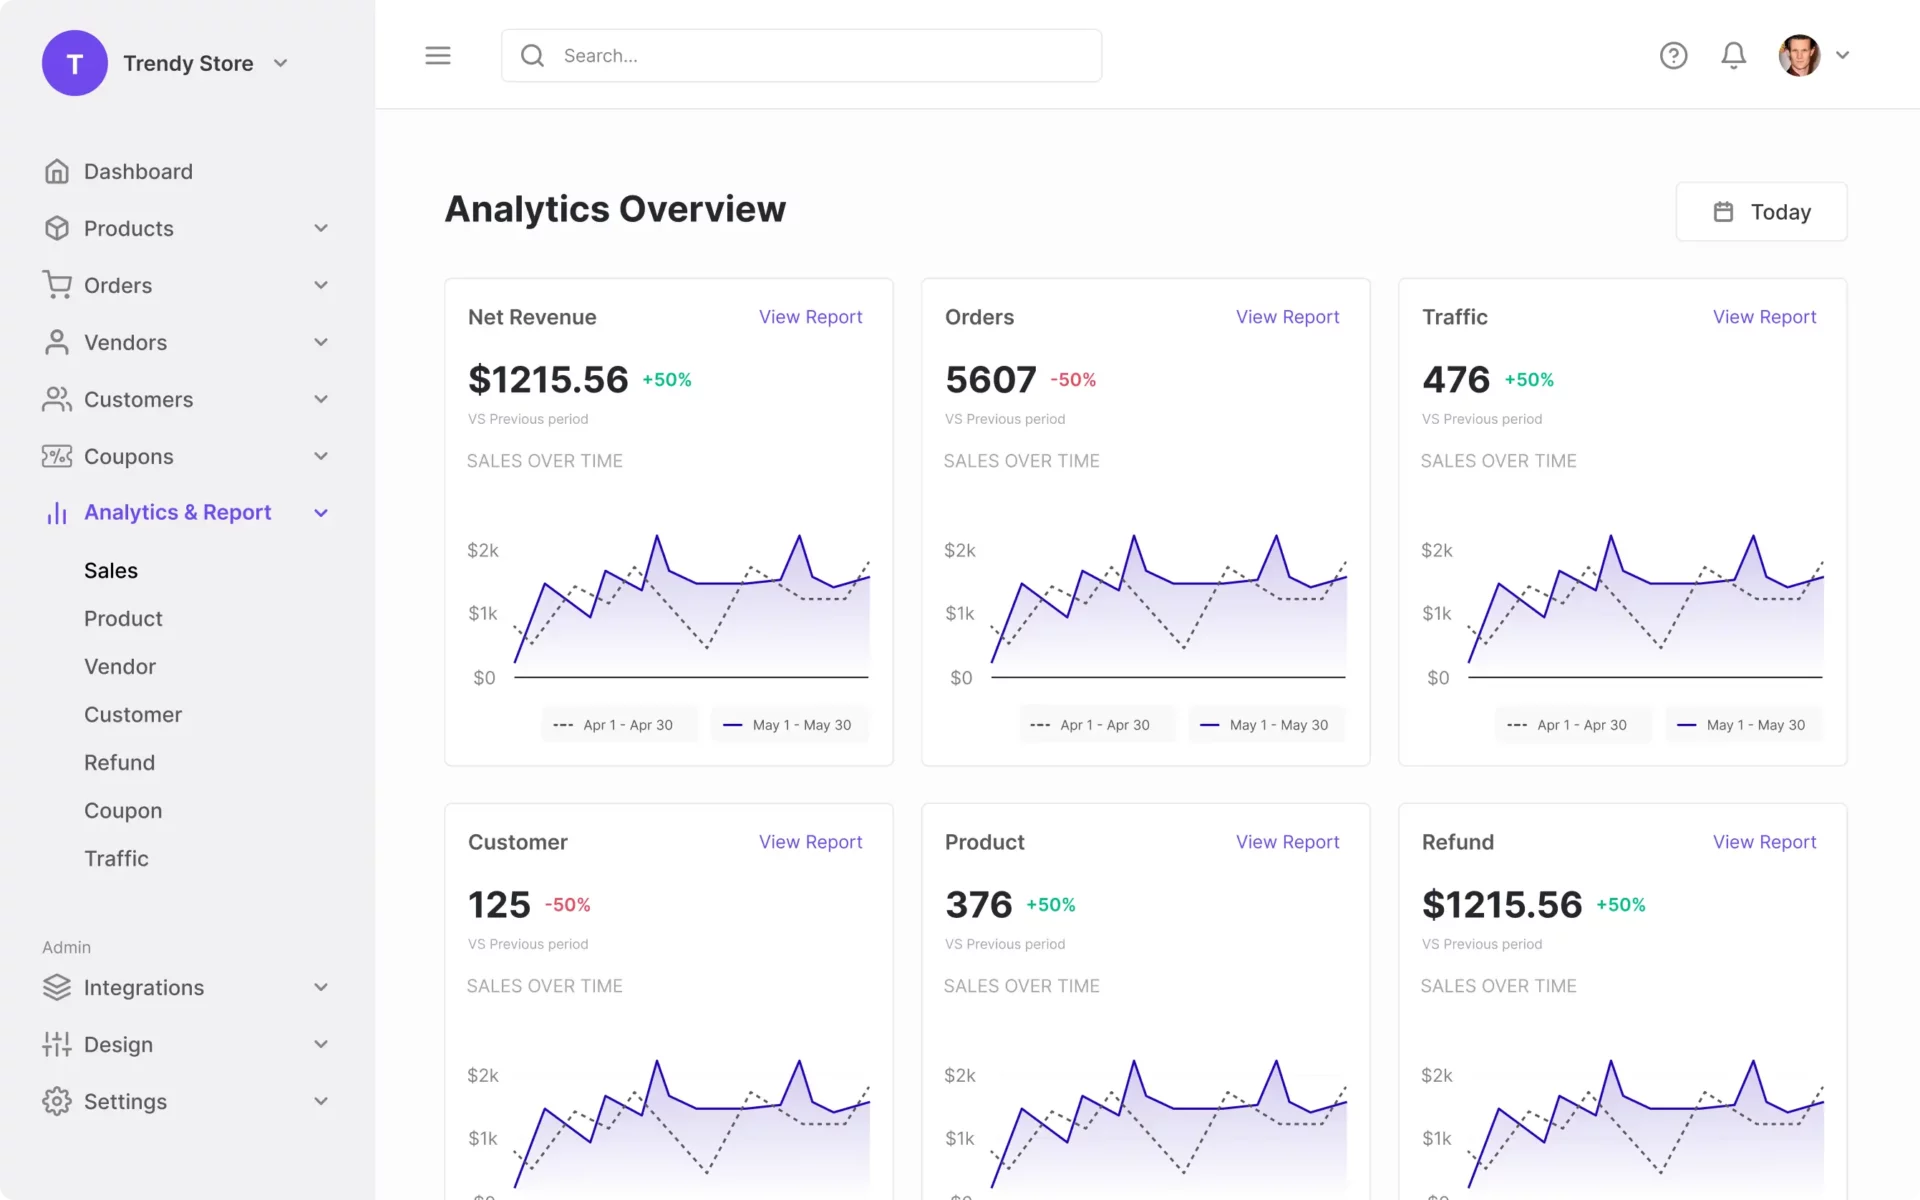
3️⃣ Sales Reports in Dokan
Sales reports show how money flows through your marketplace.
📊 Common Sales Metrics:
-
Daily / weekly / monthly sales
-
Gross vs net revenue
-
Vendor-wise sales
-
Product-wise sales
✅ Best Practice:
-
Review sales weekly
-
Compare month-over-month growth
-
Identify seasonal trends
👉 Sales reports guide pricing and promotion decisions.
4️⃣ Commission Reports Explained
Commission is the core revenue model for most Dokan marketplaces.
🔹 Commission Reports Show:
-
Admin commission earned
-
Vendor earnings
-
Commission by vendor
-
Commission by product/category
📌 Use this data to:
-
Adjust commission rates
-
Reward top vendors
-
Identify low-margin categories
5️⃣ Vendor Performance Reports
Not all vendors contribute equally.
🔍 Key Vendor Metrics:
-
Order completion rate
-
Cancellation rate
-
Refund frequency
-
Response time
-
Customer ratings
✅ Best Practice:
-
Identify top performers
-
Support underperformers
-
Remove repeat violators
👉 A few bad vendors can hurt the whole marketplace.
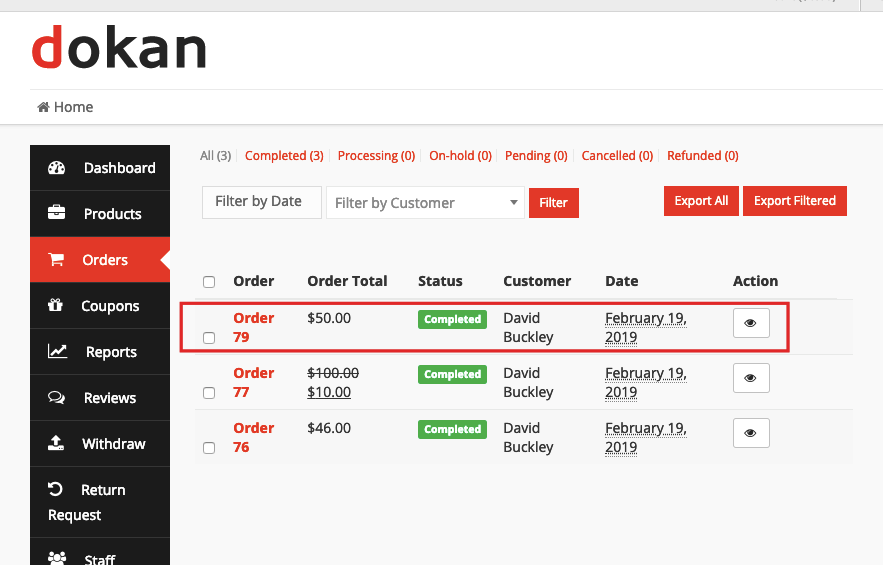
6️⃣ Order & Refund Reports
Refunds directly impact:
-
Revenue
-
Vendor trust
-
Customer satisfaction
🔹 Dokan Reports Help You Track:
-
Refund count
-
Refund reasons
-
Vendor-level refunds
-
Dispute patterns
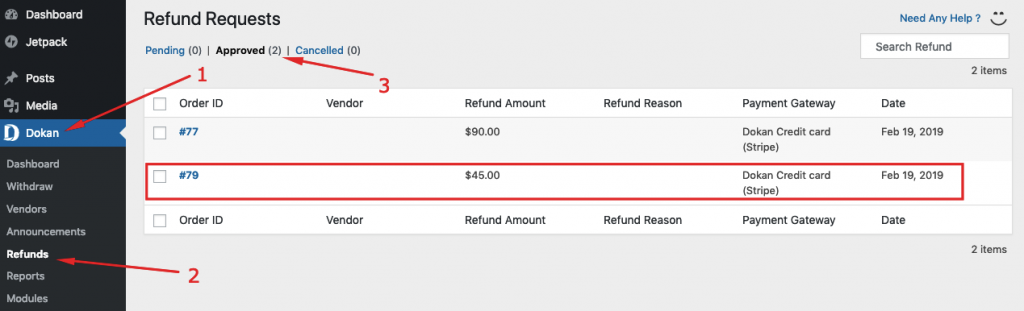
📌 High refund rate = operational issue, not bad luck.
7️⃣ Withdrawal & Payout Reports
Cash flow visibility is critical.
🔹 Withdrawal Reports Show:
-
Pending withdrawals
-
Approved withdrawals
-
Rejected requests
-
Vendor balances
✅ Use These Reports To:
-
Plan payouts
-
Detect suspicious activity
-
Maintain vendor trust
👉 Delayed or unclear payouts cause vendor churn.
8️⃣ Using Analytics to Grow Your Marketplace
Analytics should drive action, not just numbers.
📈 Growth Actions Based on Data:
-
Promote top-selling categories
-
Feature high-performing vendors
-
Improve weak product categories
-
Optimize commission structure
-
Reduce refund-heavy products
👉 Data-driven marketplaces scale faster and safer.
9️⃣ Common Analytics Mistakes in Dokan
❌ Checking reports once a year
❌ Ignoring vendor-level data
❌ Not acting on refund trends
❌ No performance benchmarks
❌ No vendor feedback loop
These mistakes lead to slow, uncontrolled growth.
🔟 Best Practices for Dokan Analytics & Reporting
✔ Review reports weekly
✔ Track trends, not just totals
✔ Share performance insights with vendors
✔ Use data to refine policies
✔ Combine analytics with vendor communication
👉 Analytics + action = sustainable marketplace success.
📚 Also Read (Internal Links)

Hire Me on Upwork – Dokan & WooCommerce Expert
