


Default reports are useful — but if you’re running a serious marketplace, they’re not enough.
To truly understand your business, you need custom reports tailored to your marketplace model.
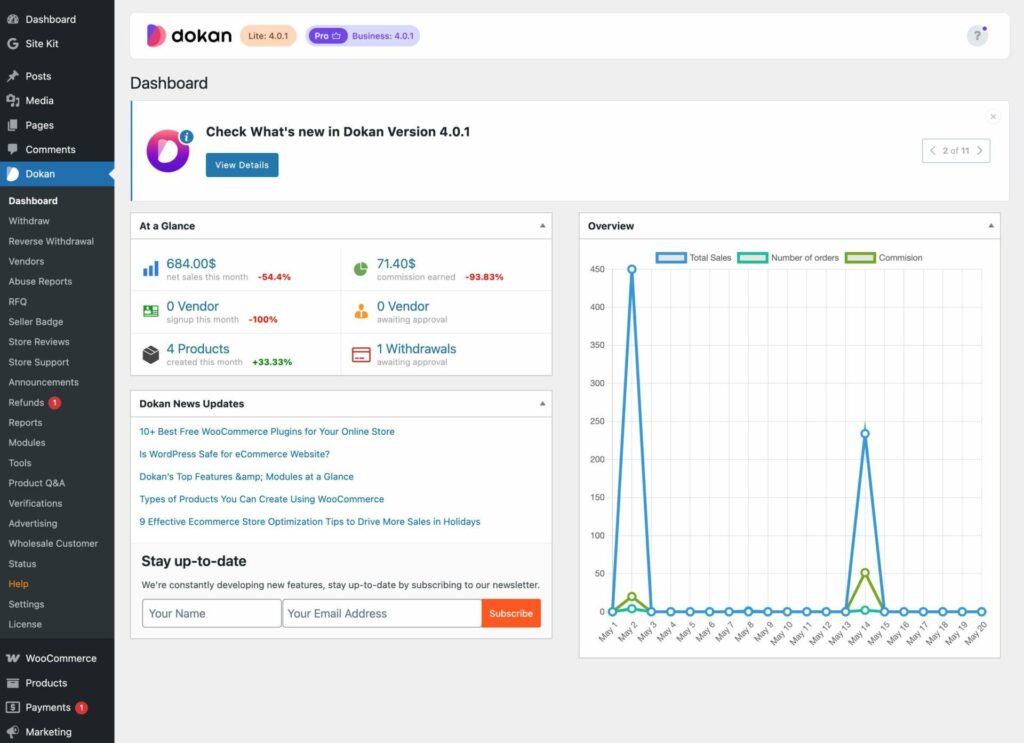
If you’re using Dokan with WooCommerce on WordPress, custom reports can help you track vendors, sales, commissions, and performance in detail.
In this guide, you’ll learn how to build custom reports in Dokan.
🔴 What are Custom Reports?
Custom reports are tailored analytics dashboards that show data specific to your business.
Instead of generic data, you can track:
✔ Vendor performance
✔ Commission earnings
✔ Category sales
✔ Order trends
👉 Custom reports = actionable insights
🧠 Why You Need Custom Reports
Default reports often lack:
❌ Detailed vendor insights
❌ Custom KPIs
❌ Business-specific data
With custom reports:
✔ Better decision making
✔ Detailed analytics
✔ Improved performance
✔ Scalable insights
👉 Data-driven marketplace growth.
📊 Key Reports You Should Build
💰 1️⃣ Revenue Reports
Track:
✔ Total revenue
✔ Vendor-wise revenue
✔ Daily/monthly sales
👉 Understand business growth.
🏪 2️⃣ Vendor Performance Reports
Track:
✔ Top vendors
✔ Low-performing vendors
✔ Ratings & reviews
👉 Improve vendor quality.
📦 3️⃣ Order Reports
Track:
✔ Order volume
✔ Order status
✔ Delivery performance
👉 Optimize operations.
💸 4️⃣ Commission Reports
Track:
✔ Marketplace earnings
✔ Vendor commissions
✔ Payout history
👉 Manage finances.
🧑💻 5️⃣ Customer Insights
Track:
✔ New vs returning customers
✔ Purchase behavior
✔ Lifetime value
👉 Improve marketing.
⚙️ How to Build Custom Reports
🧑💻 Method 1: Custom Development (Advanced)
Using WordPress & WooCommerce:
✔ Query database (wp_posts, wp_postmeta)
✔ Use custom SQL queries
✔ Build admin dashboards
✔ Use charts (Chart.js, etc.)
👉 Full control over data.
🔌 Method 2: Use Reporting Plugins
Plugins can simplify reporting.
Popular tools:
✔ Metorik
✔ Advanced WooCommerce Reporting
✔ WP DataTables
👉 Faster setup.
📊 Method 3: External Dashboards
Use tools like:
✔ Google Data Studio (Looker Studio)
✔ Power BI
👉 Connect via API.
📈 Dashboard Design Best Practices
✔ Use charts & graphs
✔ Show key metrics at top
✔ Use filters (date, vendor, category)
✔ Keep UI simple
👉 Improves usability.
🔁 Automate Reports
✔ Daily/weekly reports
✔ Email summaries
✔ Scheduled exports
👉 Saves time.
🔐 Data Accuracy & Security
Ensure:
✔ Correct queries
✔ Secure data access
✔ Role-based permissions
👉 Protects sensitive data.
📱 Mobile-Friendly Reports
✔ Responsive dashboards
✔ Easy navigation
✔ Quick insights
👉 Important for admins on the go.
🚀 Advanced Features
Add:
✔ Real-time analytics
✔ Predictive insights (AI)
✔ Vendor scorecards
✔ KPI tracking
👉 Next-level reporting.
📈 Real Impact of Custom Reports
After implementation:
✔ Better decisions
✔ Increased revenue
✔ Improved vendor performance
✔ Faster growth
👉 Data becomes your advantage.
🚨 Common Mistakes to Avoid
❌ Too many metrics
❌ Poor UI design
❌ No data validation
❌ Ignoring performance
👉 Keep it focused.
📌 Custom Reporting Checklist
✔ Define KPIs
✔ Choose method (code/plugin)
✔ Build dashboards
✔ Test data accuracy
✔ Automate reports
👉 Follow this step-by-step.
📚 Internal Links

Hire Me on Upwork – Dokan & WooCommerce Expert
