
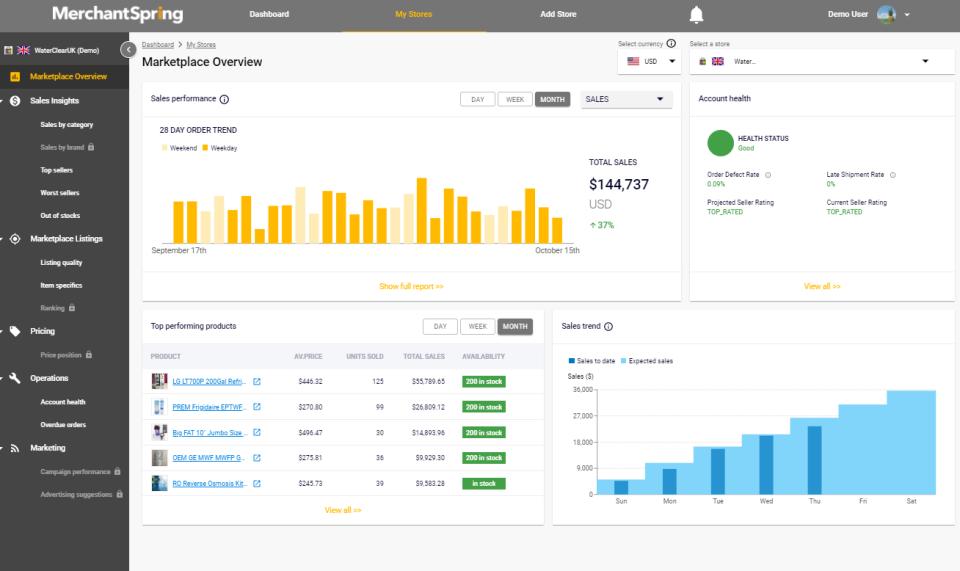
Dokan: Vendor Performance Dashboard (Complete Guide)
A successful multi-vendor marketplace depends on the performance of its vendors. Marketplace owners need clear insights into sales, orders, customer satisfaction, payouts, and overall business growth, while vendors need real-time analytics to make informed decisions.
The Dokan Vendor Performance Dashboard provides vendors with essential business metrics, helping them monitor store performance, improve sales, optimize inventory, and enhance customer satisfaction.
In this guide, you’ll learn how to build and optimize a powerful vendor performance dashboard in Dokan using analytics, reporting tools, automation, and third-party integrations.
What is a Vendor Performance Dashboard?
A Vendor Performance Dashboard is a centralized analytics panel that displays important business metrics for each vendor.
Instead of manually reviewing reports, vendors can monitor their business from a single dashboard.
Typical dashboard metrics include:
- Total Sales
- Revenue
- Orders
- Product Views
- Conversion Rate
- Customer Reviews
- Refund Requests
- Inventory Status
- Withdrawals
- Store Performance
A well-designed dashboard helps vendors make smarter business decisions.
Why Vendor Analytics Matter
Analytics help vendors understand:
- Which products sell best
- Which products need improvement
- Customer buying behavior
- Seasonal trends
- Inventory requirements
- Marketing performance
- Profitability
Better insights lead to better business growth.
Dashboard Overview
The homepage dashboard should display:
Total Revenue
Overall sales generated.
Monthly Revenue
Current month’s income.
Orders
Total completed orders.
Pending Orders
Orders awaiting processing.
Refund Requests
Open customer refund cases.
Withdrawal Balance
Available earnings.
Product Count
Active products in the store.
A clean dashboard provides an instant business overview.
Sales Analytics
Sales reports should include:
Daily Sales
Weekly Sales
Monthly Sales
Annual Sales
Custom Date Reports
Charts help vendors identify trends over time.
Revenue Reports
Display:
Gross Revenue
Net Revenue
Marketplace Commission
Taxes
Shipping Charges
Discounts
Understanding revenue breakdown improves financial planning.
Order Analytics
Track:
New Orders
Completed Orders
Cancelled Orders
Refunded Orders
Average Order Value
Order analytics reveal customer purchasing behavior.
Product Performance
Identify high-performing products.
Metrics include:
Best Sellers
Low Performing Products
Product Views
Conversion Rate
Revenue by Product
This helps vendors optimize their catalog.
Inventory Dashboard
Monitor inventory using:
Low Stock Alerts
Out-of-Stock Products
Fast-Moving Products
Slow-Moving Products
Inventory Value
Inventory reports reduce stock shortages.
Customer Analytics
Track customer activity.
Important metrics include:
New Customers
Returning Customers
Customer Lifetime Value
Repeat Purchase Rate
Geographic Distribution
Customer insights improve marketing strategies.
Review & Rating Analytics
Display:
Average Rating
Total Reviews
Product Ratings
Negative Reviews
Review Response Rate
Positive reviews improve marketplace trust.
Refund Reports
Track:
Refund Requests
Refund Amount
Refund Reasons
Refund Approval Rate
Reducing refunds increases profitability.
Commission Reports
Allow vendors to see:
Marketplace Fees
Net Earnings
Pending Withdrawals
Withdrawal History
Transparent commission reporting builds trust.
Store Traffic Analytics
Track website activity.
Metrics include:
Store Visitors
Product Views
Bounce Rate
Session Duration
Traffic Sources
Traffic reports help optimize marketing.
Marketing Dashboard
Measure campaign performance.
Track:
Coupon Usage
Email Campaigns
Social Media Traffic
Referral Sales
Paid Advertising
Marketing insights improve ROI.
Financial Reports
Display:
Revenue
Expenses
Profit
Taxes
Average Order Value
Cash Flow
Financial reports support business planning.
Performance Score
Create a vendor score based on:
- Sales Performance
- Customer Ratings
- Order Fulfillment
- Refund Rate
- Response Time
- Product Quality
Performance scores encourage vendors to improve.
AI-Powered Insights
Integrate AI to provide:
Sales Forecasting
Product Recommendations
Inventory Predictions
Customer Behavior Analysis
Revenue Forecasts
AI helps vendors make proactive decisions.
Export Reports
Allow vendors to export reports in:
CSV
Excel
Google Sheets
Easy exports simplify accounting and reporting.
Mobile Dashboard
Ensure the dashboard supports:
Responsive Design
Mobile Charts
Quick Reports
Push Notifications
Most vendors manage stores from mobile devices.
Notifications & Alerts
Notify vendors about:
Low Inventory
New Orders
High Sales Days
Withdrawal Approval
Customer Reviews
Performance Milestones
Real-time alerts improve responsiveness.
Performance Optimization
Analytics dashboards should load quickly.
Optimize using:
LiteSpeed Cache
Redis Object Cache
Database Indexing
Cloudflare CDN
Lazy Loading Charts
Fast dashboards improve usability.
Security Best Practices
Protect vendor data using:
SSL Certificate
Role-Based Permissions
Two-Factor Authentication
Activity Logs
Daily Backups
Security is essential for financial reporting.
Recommended Plugin Stack
Dokan Pro
Marketplace management.
WooCommerce
Order and product management.
Metorik
Advanced WooCommerce analytics.
WP Statistics
Website traffic analytics.
FluentCRM
Customer management.
Advanced Coupons
Marketing reports.
WP Mail SMTP
Reliable email notifications.
Rank Math SEO
Search engine optimization.
LiteSpeed Cache
Performance optimization.
Redis Object Cache
Database caching.
Cloudflare
Website security and CDN.
This plugin stack creates a powerful vendor analytics system.
Common Dashboard Mistakes
Too Many Metrics
Creates confusion.
No Mobile Support
Limits vendor accessibility.
Slow Reports
Hurts usability.
No Inventory Alerts
Causes stock shortages.
Missing Financial Reports
Makes planning difficult.
No AI Insights
Misses optimization opportunities.
Avoiding these issues improves vendor productivity.
Vendor Performance Dashboard Checklist
✅ Sales Dashboard
✅ Revenue Reports
✅ Order Analytics
✅ Product Performance
✅ Inventory Monitoring
✅ Customer Analytics
✅ Review Reports
✅ Commission Reports
✅ Traffic Analytics
✅ Marketing Reports
✅ Financial Dashboard
✅ Mobile Optimization
✅ Performance Optimization
✅ Security Hardening
Final Thoughts
A comprehensive Vendor Performance Dashboard is one of the most valuable features you can offer in a Dokan marketplace. By giving vendors access to real-time sales, inventory, customer, marketing, and financial insights, you empower them to make better business decisions and grow their stores.
Combining Dokan with advanced analytics tools, AI-powered insights, automated alerts, and responsive reporting creates a professional marketplace experience that benefits vendors and marketplace owners alike. The more data vendors can understand and act on, the more successful your marketplace will become.

Hire Me on Upwork – Dokan & WooCommerce Expert

 Chat on WhatsApp